|
In the graph below, the numbers on the x-axis are the sections of the house in which the numbers were recorded. The y-axis shows the amount of ants in each section. This is the original number, before any methods have been tested. 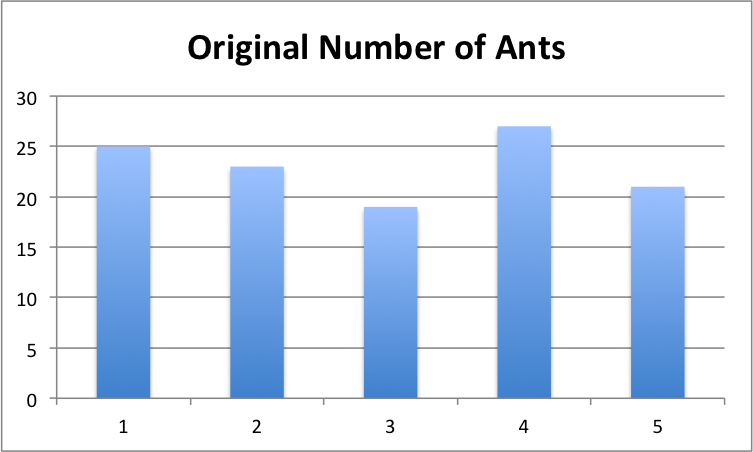 The next graph shows the progression of ant numbers in section one. 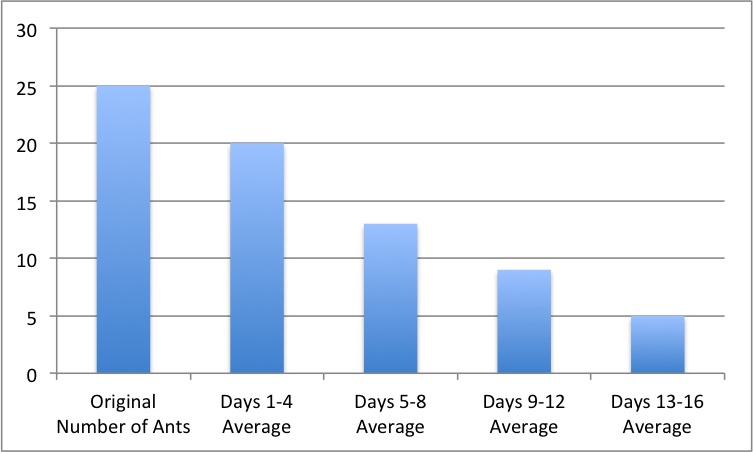 The following graph shows the same thing in section two. 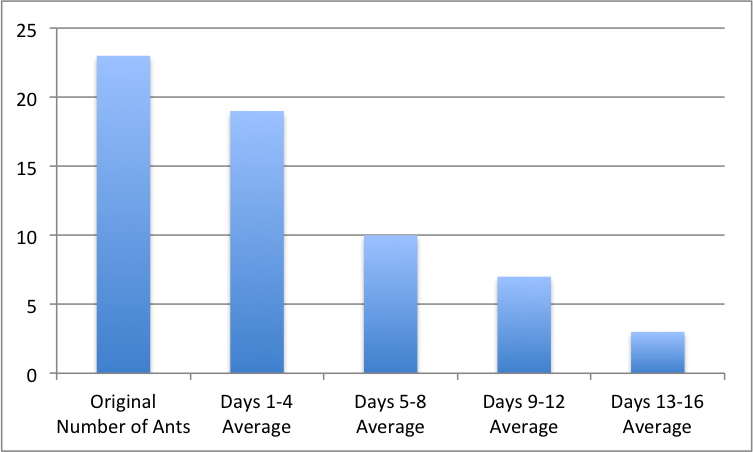 And in section three. 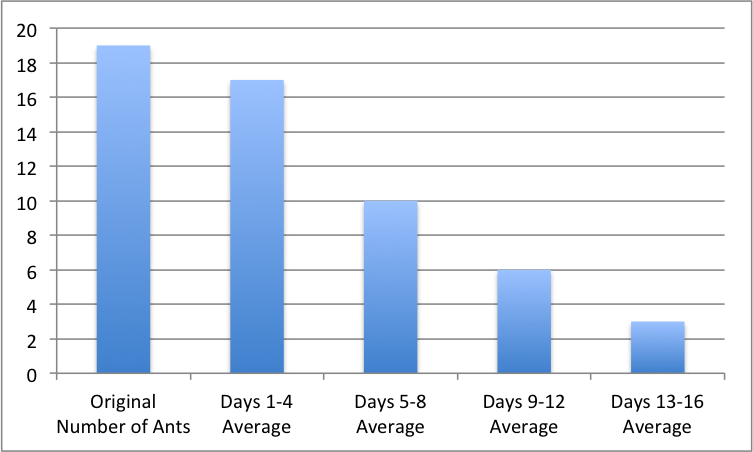 Section four. 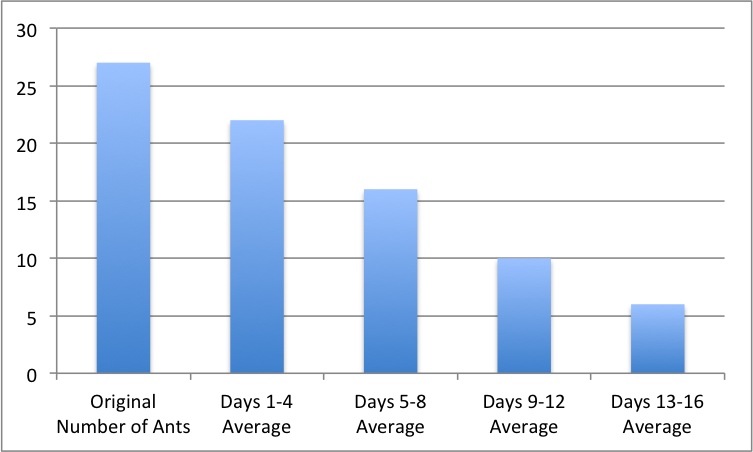 And, finally, section five. 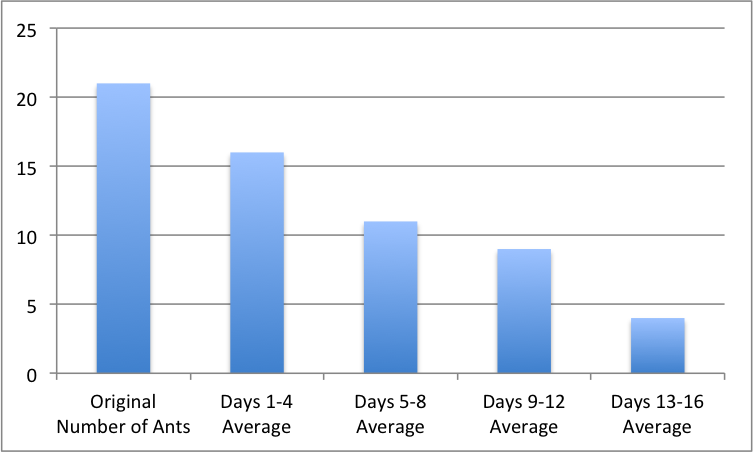 It's hard to see with the graphs, so here are the results in a table:
Section One:
Section Two
Section Three
Section Four
Section Five
In my kitchen, we have a little black ant infestation. I am going to test a few different methods of environmentally-friendly extermination to see which one works best. My goal is to remove 100% of ants, even though it's very improbable, because if there's a few, there will soon be a lot. 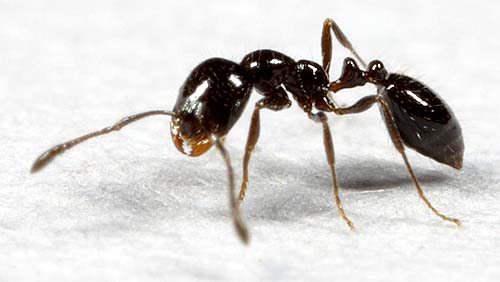 |
AuthorMaggie Neatherlin |
Getting Rid of Ants
Second Semester Term Project
 RSS Feed
