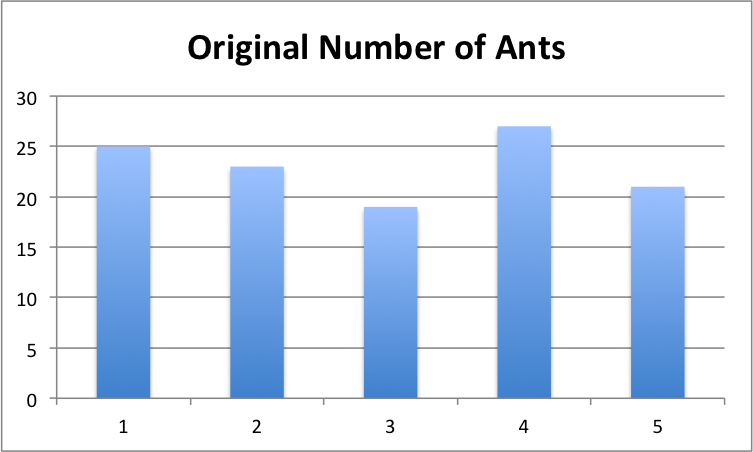
In the graph below, the numbers on the x-axis are the sections of the house in which the numbers were recorded. The y-axis shows the amount of ants in each section. This is the original number, before any methods have been tested.
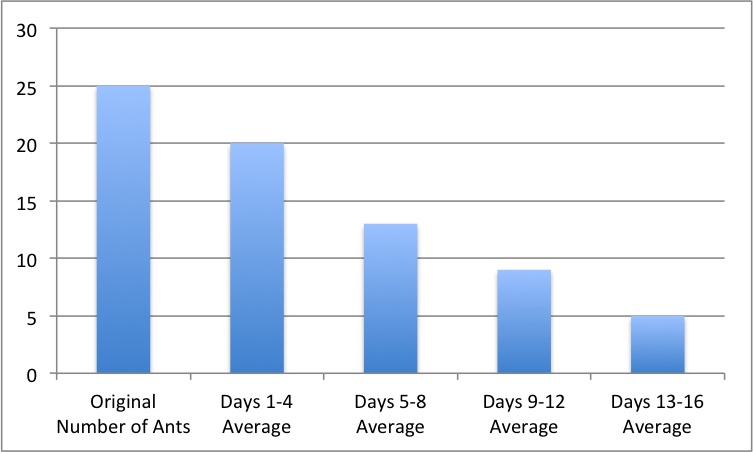
The next graph shows the progression of ant numbers in section one.
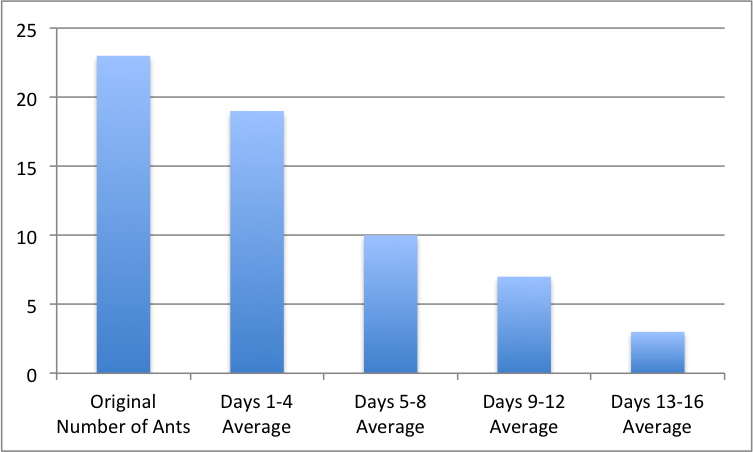
The following graph shows the same thing in section two.
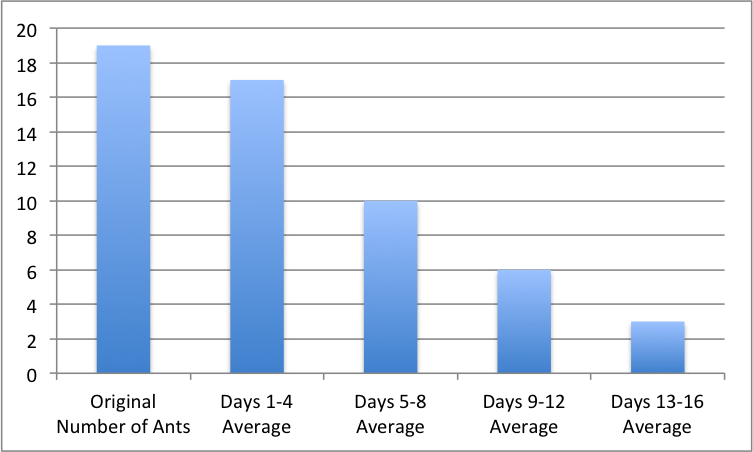
And in section three.
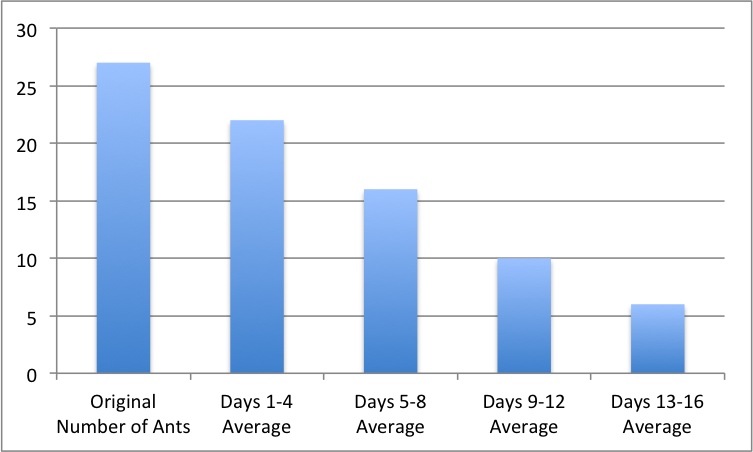
Section four.
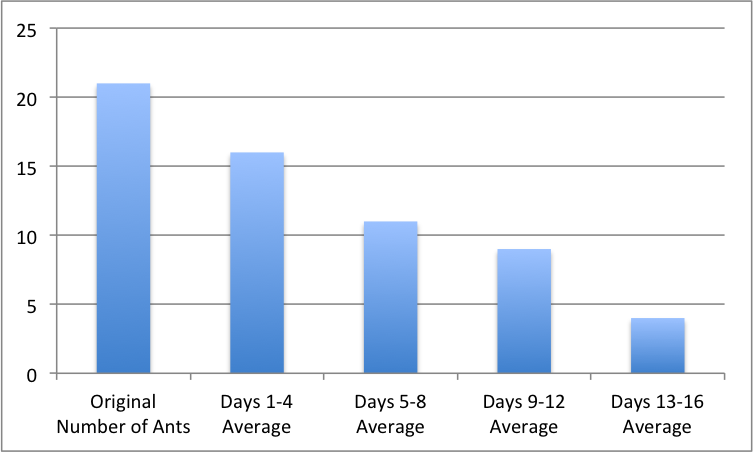
And, finally, section five.
It's hard to see with the graphs, so here are the results in a table:
Section |
Original Ant Number |
Days 1-4 Average |
Days 5-8 Average |
Days 9-12 Average |
Days 13-16 Average |
1 |
25 |
20 |
13 |
9 |
5 |
2 |
23 |
19 |
10 |
7 |
3 |
3 |
19 |
17 |
10 |
6 |
3 |
4 |
27 |
22 |
16 |
10 |
6 |
6 |
21 |
16 |
11 |
9 |
4 |
 RSS Feed
